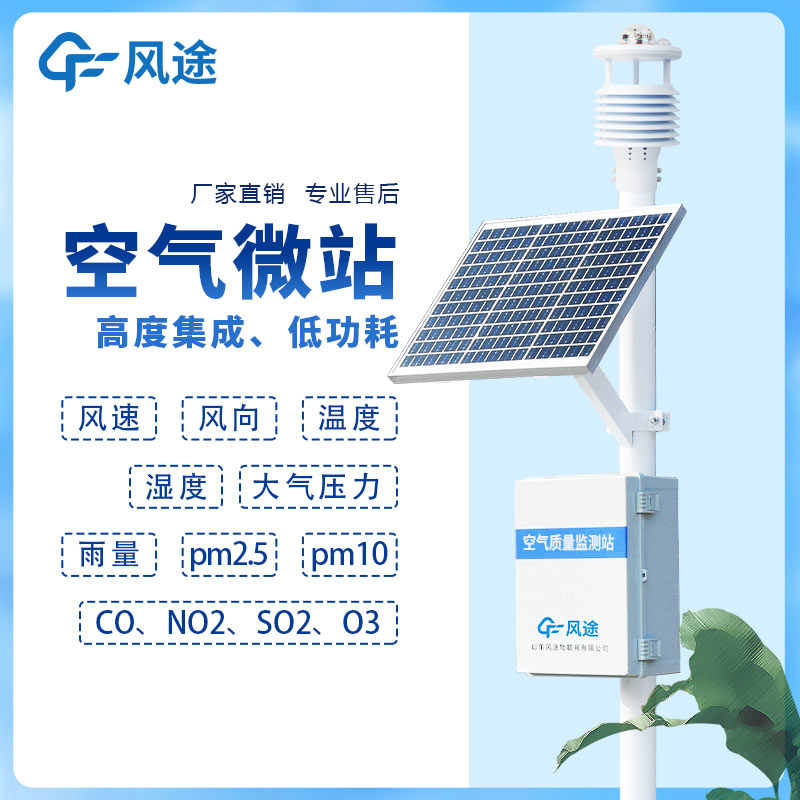
Air quality monitoring station is a monitoring system that integrates particulate matter monitoring, meteorological parameter detection, data acquisition and information processing. It is mainly used for real-time monitoring of pollution sources such as construction sites, sand and gravel quarries, coal dumps, straw burning, etc., as well as air quality in residential areas, commercial areas, roads and construction zones.
The Air quality monitoring station consists of an integrated monitoring terminal and a data platform. The terminal is capable of monitoring the concentration of particulate matter, temperature and humidity as well as the wind speed and direction, and at the same time, it automatically takes video footage when the pollutant exceeds the standard. The data platform receives data from the terminal through the Internet architecture and supports wired or wireless network transmission, which facilitates real-time data management and control. The system also contains functions such as alarm processing, data recording, querying, statistical analysis and report output.
Users can personalize the monitoring parameters according to their needs. The monitoring options cover a range of criteria pollutants, including ozone (O3), nitrogen dioxide (NO2), carbon monoxide (CO), sulfur dioxide (SO2), and total suspended particulate matter (TSP) in the PM10 and PM2.5. The system also supports the monitoring of specific environmental factors, such as temperature, humidity, wind speed, wind direction, as well as providing video monitoring functions.
The platform accurately displays the location of each monitoring device via an electronic map, and users can access real-time monitoring data by clicking on the device icon on the map. These data include key environmental indicators such as carbon dioxide, nitric oxide, sulfur dioxide, PM2.5, PM10, etc., enabling users to visualize the distribution of monitoring points and current environmental quality.
The data display function covers the monitoring area, monitoring objects, online status of the equipment as well as real-time concentrations and hourly averages of each pollutant. This display makes it easy for users to analyze and track trends in environmental quality over time.
This paper addresses:https://fengtusz.com/industry/453.html